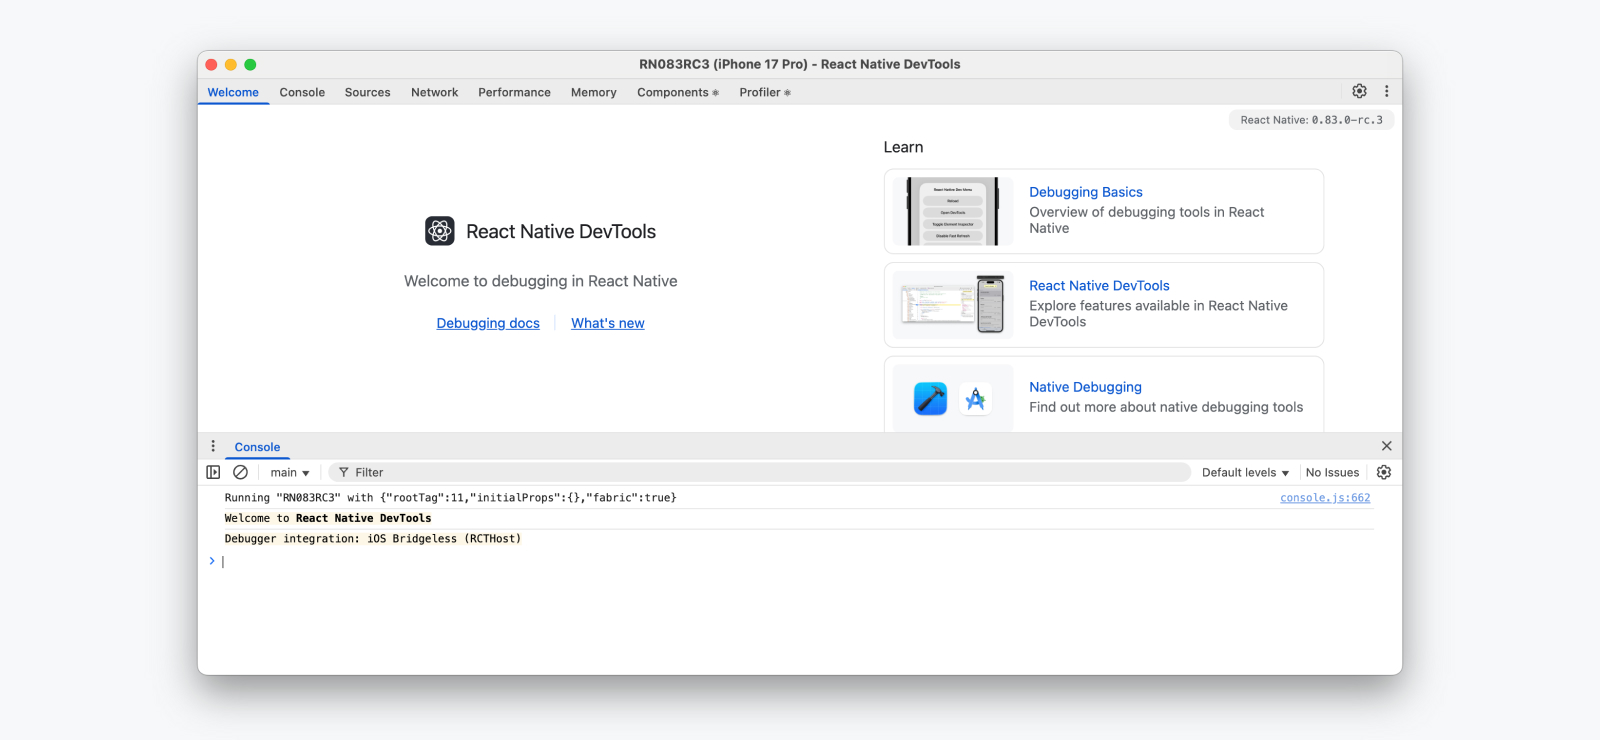
React Native 开发者工具
本页面由 PageTurner AI 翻译(测试版)。未经项目官方认可。 发现错误? 报告问题 →
React Native DevTools 是我们专为 React Native 打造的现代化调试体验。它从底层全新构建,旨在比以往调试方法实现更深度的集成、更高的准确性和更强的可靠性。
React Native DevTools 专注于解决 React 应用层的调试需求,并非用于替代原生工具。如需检查 React Native 底层平台相关功能(例如开发原生模块时),请使用 Android Studio 和 Xcode 中的调试工具(参见原生代码调试)。
💡 Compatibility — released in 0.76
React Native DevTools supports all React Native apps running Hermes. It replaces the previous Flipper, Experimental Debugger, and Hermes debugger (Chrome) frontends.
It is not possible to set up React Native DevTools with any older versions of React Native.
- Chrome Browser DevTools — unsupported
- Connecting to React Native via
chrome://inspectis no longer supported. Features may not work correctly, as the latest versions of Chrome DevTools (which are built to match the latest browser capabilities and APIs) have not been tested, and this frontend lacks our customisations. Instead, we ship a supported version with React Native DevTools.
- Connecting to React Native via
- Visual Studio Code — unsupported (pre-existing)
- Third party extensions such as Expo Tools and Radon IDE may have improved compatibility, but are not directly supported by the React team.
💡 Feedback & FAQs
We want the tooling you use to debug React across all platforms to be reliable, familiar, simple, and cohesive. All the features described on this page are built with these principles in mind, and we also want to offer more capabilities in future.
We are actively iterating on the future of React Native DevTools, and have created a centralized GitHub discussion to keep track of issues, frequently asked questions, and feedback.
核心功能
React Native DevTools 基于 Chrome DevTools 前端实现。如果您有 Web 开发背景,其功能界面会倍感熟悉。建议您先浏览Chrome DevTools 文档,其中包含完整指南和视频资源。
控制台
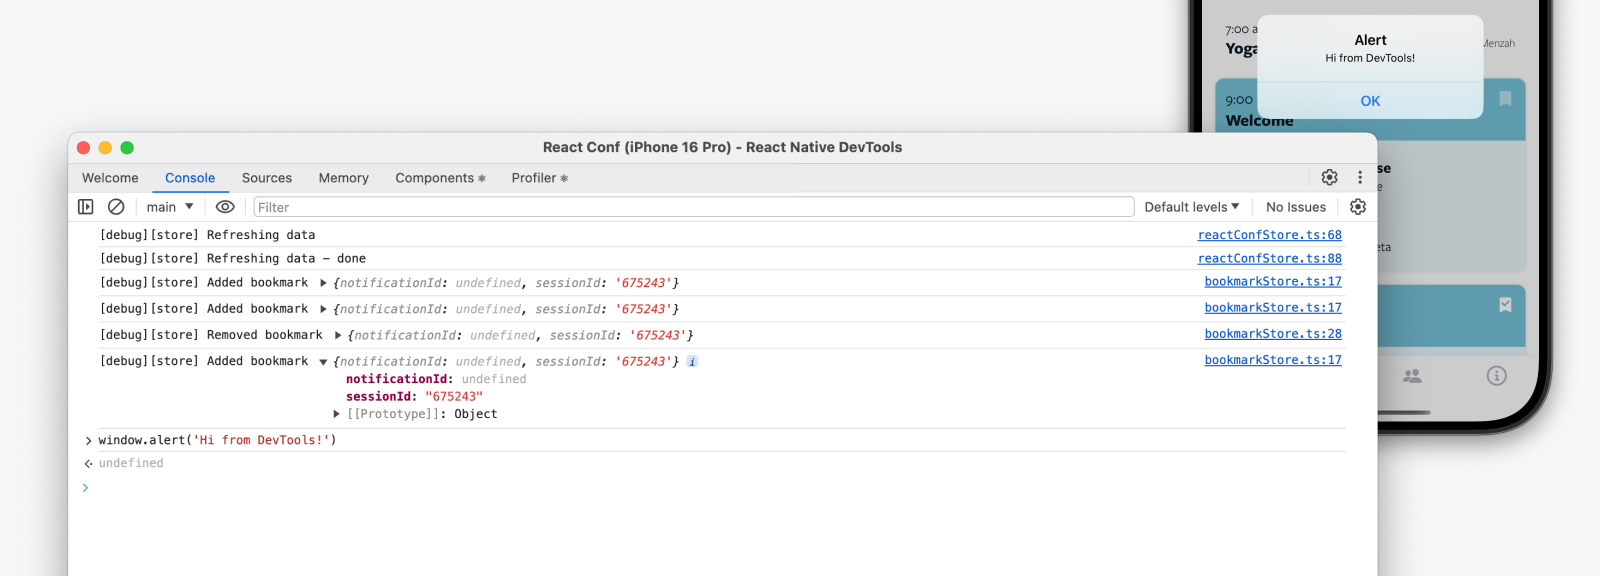
控制台面板支持查看/筛选消息、执行 JavaScript、检查对象属性等功能。
实用技巧
源代码与断点
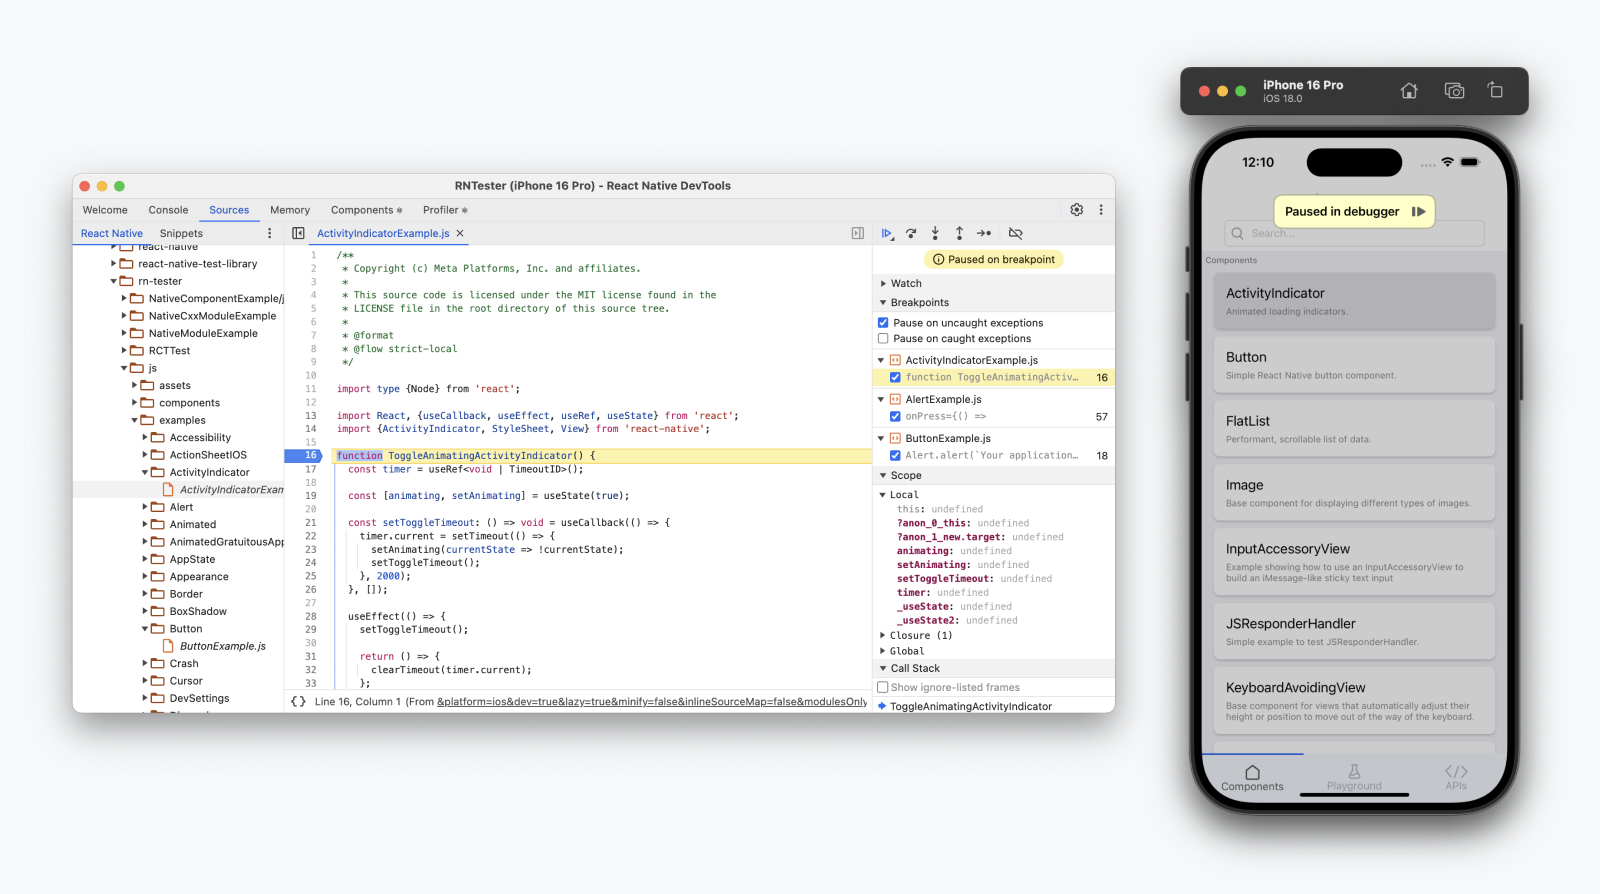
源代码面板支持查看应用源文件并设置断点。断点用于指定程序暂停执行的代码行,便于检查实时状态并逐行调试。
实用技巧
-
当应用暂停时会出现 "Paused in Debugger" 覆盖层,点击即可恢复运行。
-
在断点处暂停时,请注意右侧面板,它允许你检查当前作用域和调用栈,并设置监视表达式。
-
在代码编辑器中使用
debugger;语句快速设置断点,该变更会通过快速刷新即时同步到设备 -
断点类型多样!例如条件断点与日志点
Network Since 0.83
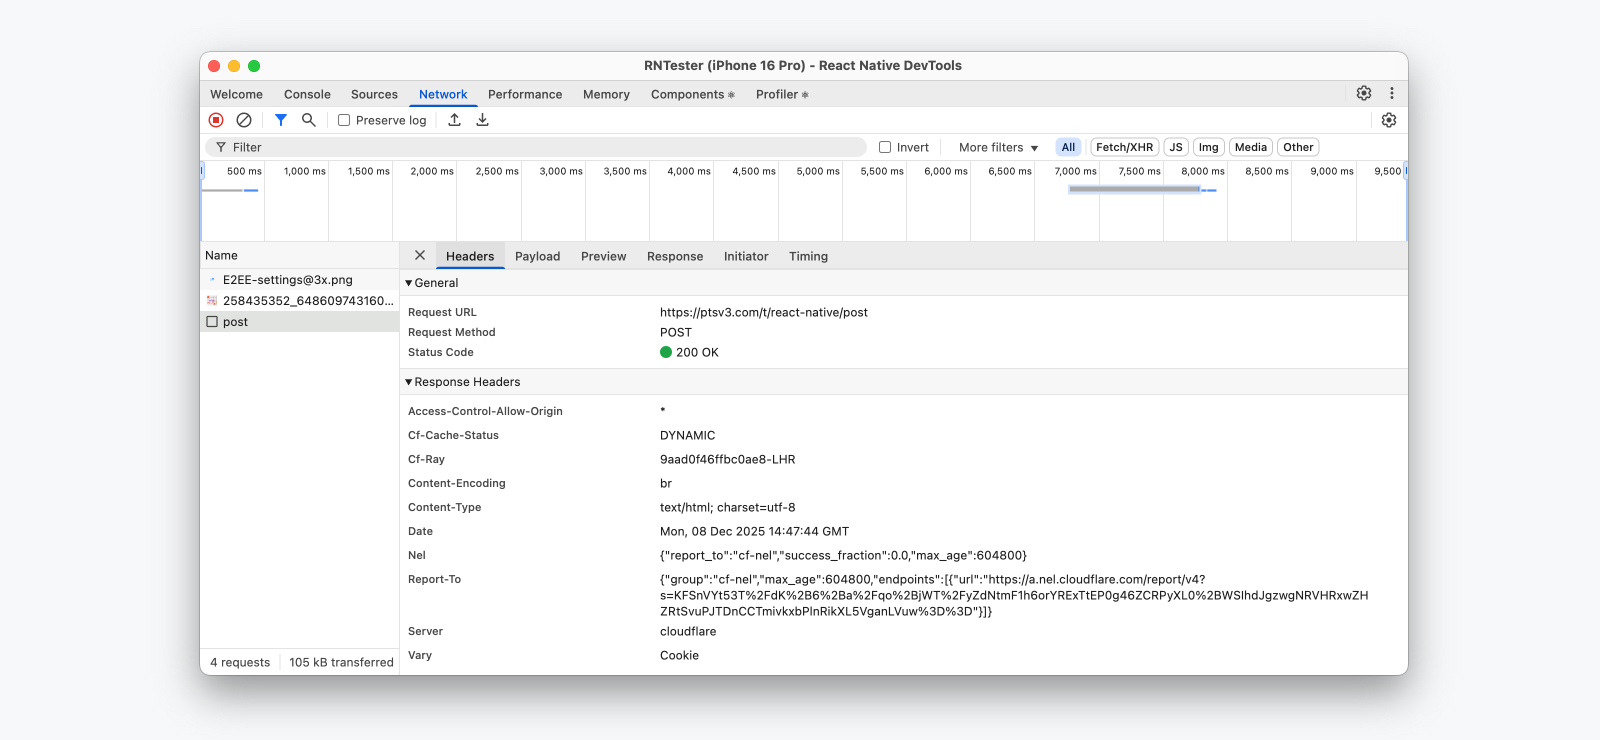
网络面板允许你查看并检查应用发起的网络请求。记录的请求提供详细元数据,包括时间信息、发送/接收的标头以及响应预览。
当 DevTools 开启时,网络请求会自动记录。我们支持 Chrome 的大部分功能,但存在一些例外。详见下文。
💡 Network event coverage, Expo support
Which network events are captured?
Today, we record all network calls through fetch(), XMLHttpRequest, and <Image> — with support for custom networking libraries, such as Expo Fetch, coming later.
Expo Network differences
Because of this, apps using Expo will continue to see the "Expo Network" panel — a separate implementation by the Expo framework which will log these additional request sources but has slightly reduced features.
- Coverage for Expo-specific network events.
- No request initiator support.
- No Performance panel integration.
We're working with Expo to integrate Expo Fetch and third party networking libraries with our new Network inspection pipeline in future releases.
Unimplemented features
At launch, these are the features we don't yet support in React Native:
- WebSocket events
- Network response mocking
- Simulated network throttling
💡 Response previews buffer size
If you are inspecting a large volume of response data, please note that response previews are cached in an on-device buffer with a maximum size of 100MB. This means we may evict response previews (but not metadata) if the cache becomes too large, oldest request first.
实用技巧
-
使用发起方(Initiator)标签页查看网络请求在应用中的发起调用栈。
-
网络事件也会显示在性能面板的网络轨道中。
Performance Since 0.83
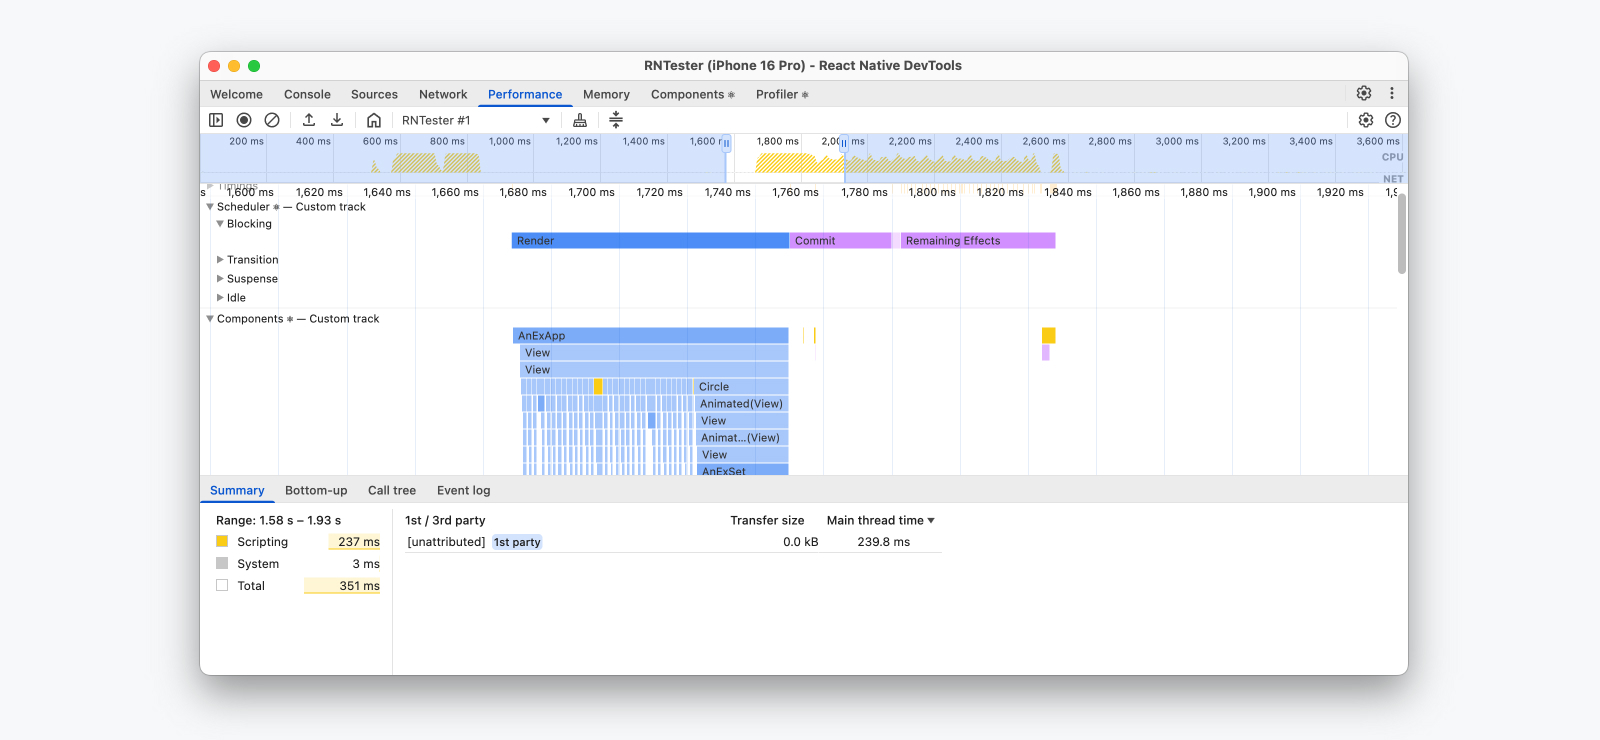
性能追踪功能允许你在应用中记录性能会话,以了解 JavaScript 代码的运行情况以及哪些操作耗时最多。在 React Native 中,我们会在单一性能时间线中展示 JavaScript 执行、React 性能轨道、网络事件以及自定义用户计时(User Timings)。
实用技巧
-
使用标注功能(按住 Shift 拖拽)标记性能追踪记录 — 在下载并与队友分享追踪记录时非常实用。标注功能还能快速测量时间跨度(以秒计)。
-
在应用中使用
PerformanceObserverAPI 在运行时观察性能事件 — 适用于需要捕获性能遥测的场景。
了解更多
内存分析
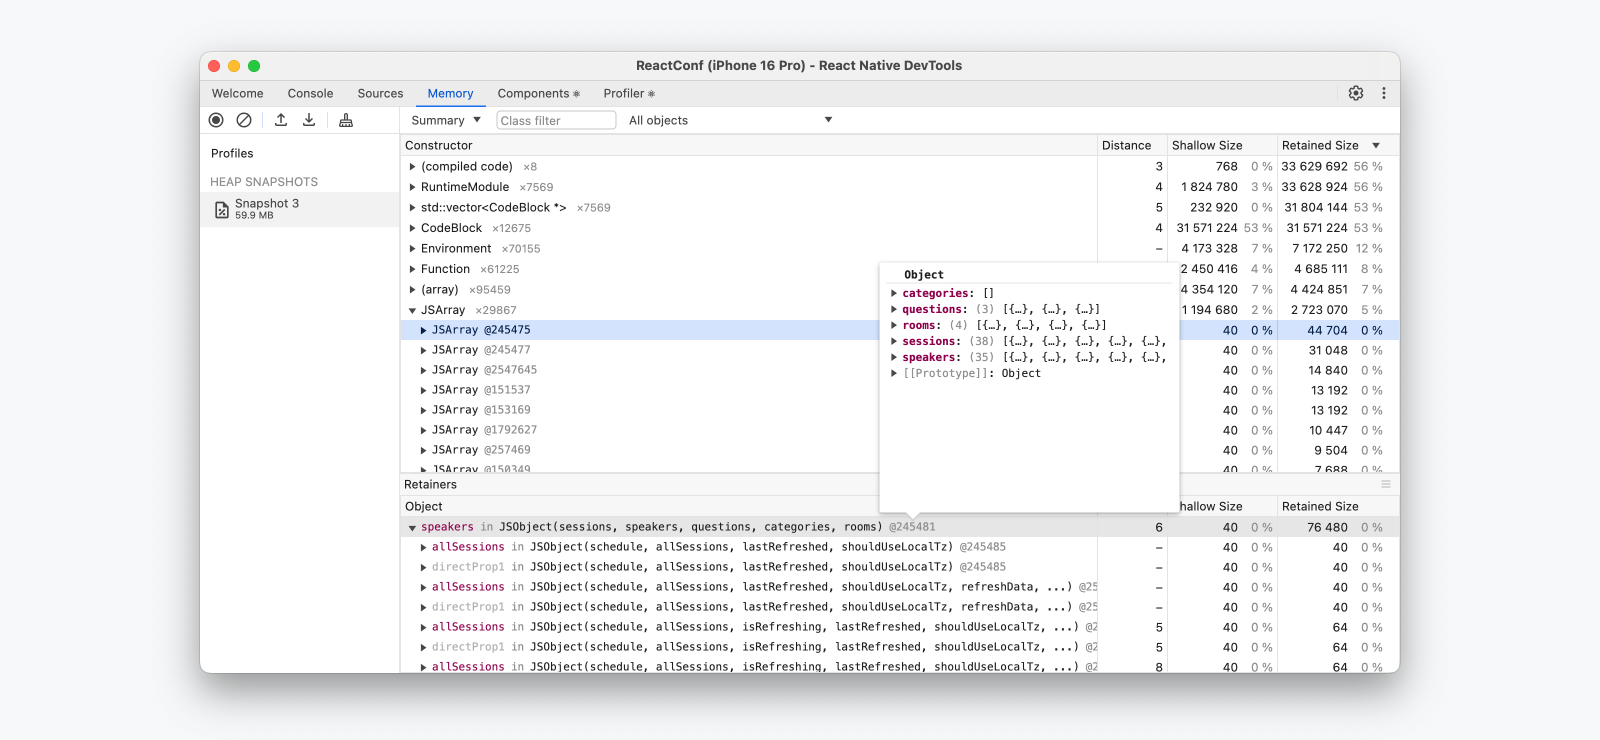
内存面板支持获取堆快照,并监测 JavaScript 代码随时间变化的内存使用情况。
实用技巧
-
使用 Cmd ⌘+F / Ctrl+F 在堆中筛选特定对象
-
创建分配时间线报告可帮助查看内存使用随时间变化的图表,识别潜在内存泄漏
React DevTools 功能
在集成的"组件(Components)"和"性能分析器(Profiler)"面板中,您将体验到完整版React DevTools浏览器扩展的功能,这些功能在React Native DevTools中可无缝使用
React组件
React组件面板允许您检查和更新渲染中的React组件树
-
在 DevTools 中悬停或选中元素,即可在设备上高亮显示该元素。
-
要定位开发者工具中的元素,点击左上角"选择元素"按钮,然后在应用中点击任意元素
实用技巧
-
组件的props和state可在运行时通过右侧面板查看和修改
-
使用React Compiler优化的组件会显示"Memo ✨"标记
React性能分析器
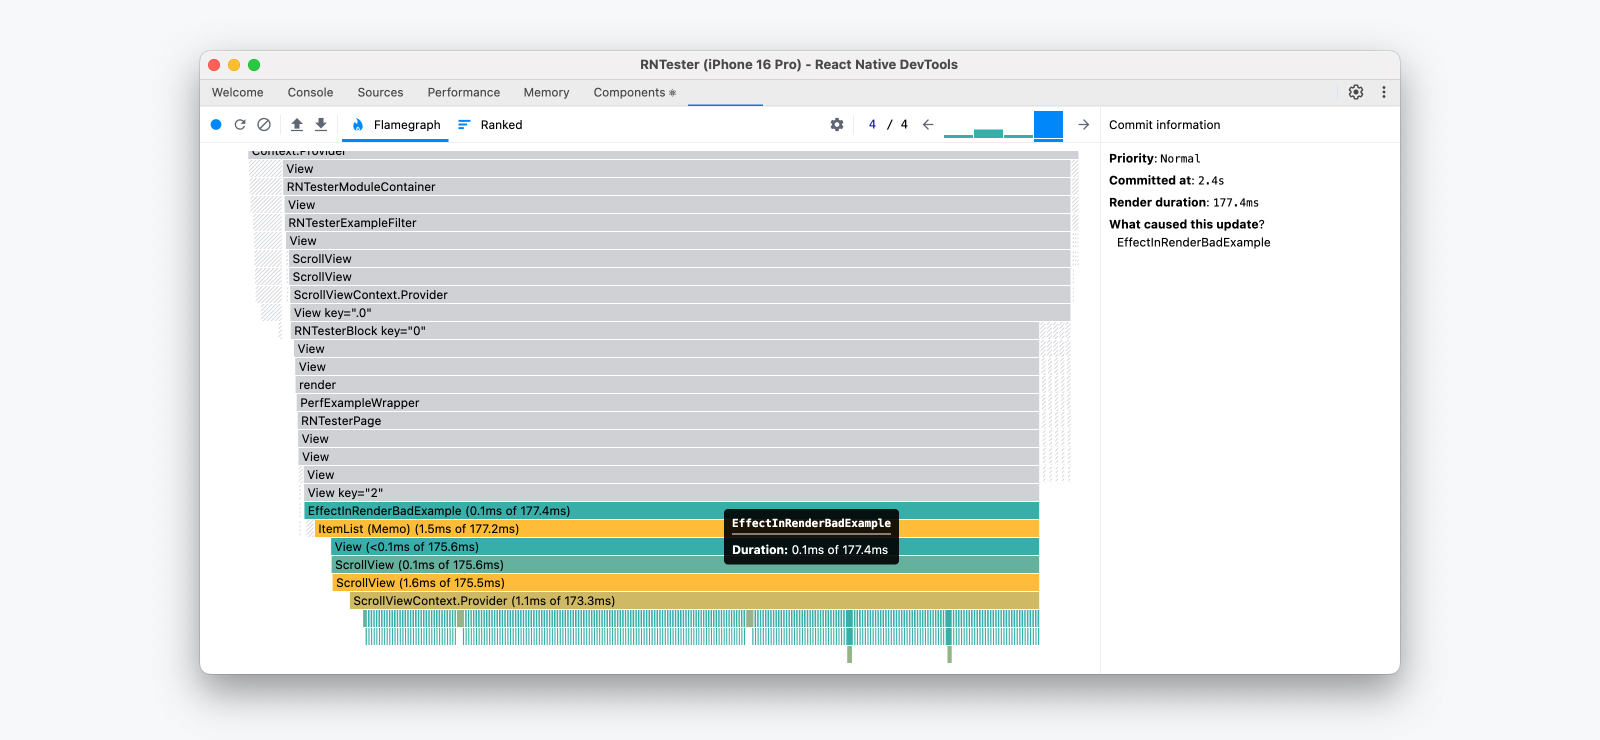
React性能分析器面板可记录性能分析数据,帮助理解组件渲染和React提交(commit)的时间分布
更多信息请参阅2018年原始指南(请注意部分内容可能已过时)
重新连接开发者工具
开发者工具偶尔会与目标设备断开连接,可能发生在以下情况:
-
应用关闭时
-
应用重新构建时(安装了新的原生构建版本)
-
应用在原生端崩溃。
-
开发服务器(Metro)退出时
-
物理设备断开连接时
断开连接时会显示对话框提示"调试连接已关闭"
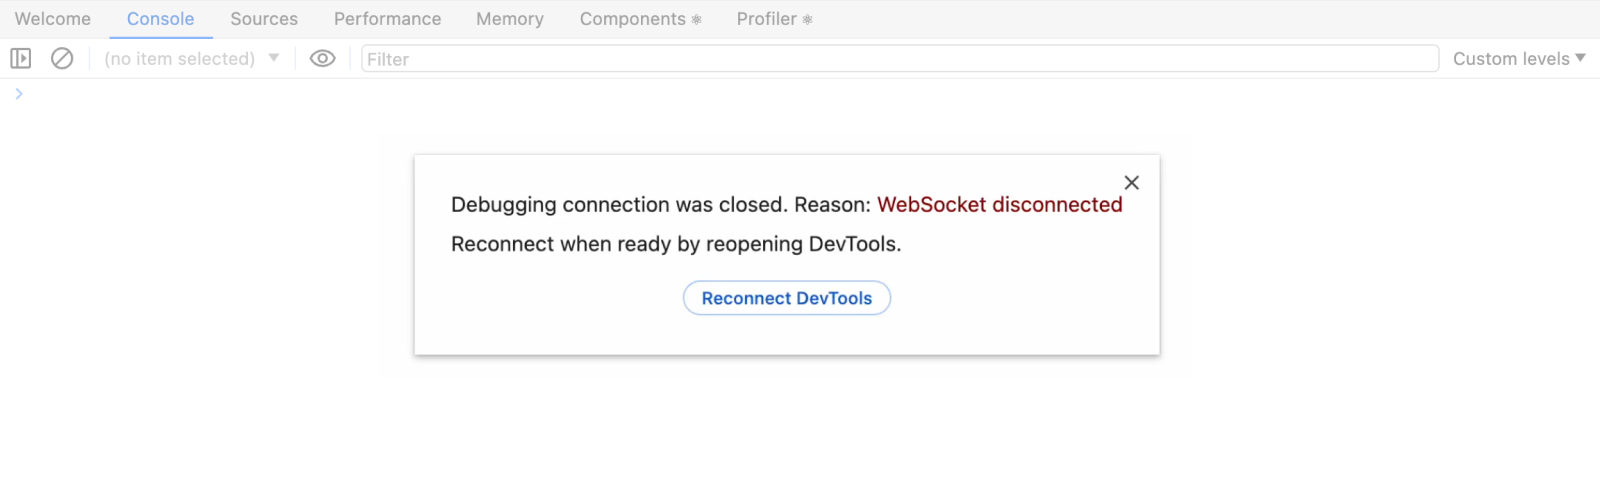
此时您可以选择:
-
关闭:点击关闭图标(
×)或对话框外部区域,返回断开连接前的开发者工具界面 -
重新连接:选择"重新连接开发者工具",需先解决导致断开的问题